Image


Fast, affordable Internet access for all.
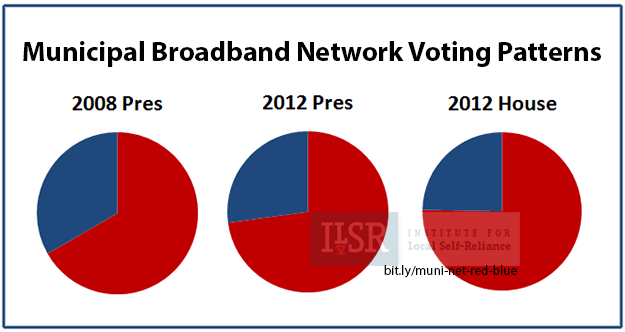 Some 3 out of 4 communities have voted Republican in recent elections, a trend that has become more pronounced across these elections. And as elections in non-presidential years tend to skew more conservative, we would expect the results to show an even greater trend toward voting for Republicans.
With President Obama speaking out in support of community networks, it will be interesting to see how Republicans in the Senate and House react. Some Republicans have taken strong stances to limit local authority in favor of states interfering in local matters like how to ensure businesses have high quality Internet access.
But at the local level, this is an issue of jobs and education, not one of a rigid ideology. We've noted in the past how local Republicans and Democrats have fought side by side on these matters. But last year, National Journal traced the growth of partisanship on municipal networks at the federal level.
In this analysis, we counted each community as one vote. Chattanooga, with its large population counts the same as tiny Windom, Minnesota. We analyzed the data in two different ways to ensure that clusters of municipal networks didn't bias the results. Some districts have multiple municipal networks within them, so we first considered every community to have one vote and then we separately considered just every district that has a network. This means that if a district had 5 municipal networks, in one analysis it would count 5 times and in the other, it would only count once. The results were very similar so we just show the pie charts where every community is included.
Some 3 out of 4 communities have voted Republican in recent elections, a trend that has become more pronounced across these elections. And as elections in non-presidential years tend to skew more conservative, we would expect the results to show an even greater trend toward voting for Republicans.
With President Obama speaking out in support of community networks, it will be interesting to see how Republicans in the Senate and House react. Some Republicans have taken strong stances to limit local authority in favor of states interfering in local matters like how to ensure businesses have high quality Internet access.
But at the local level, this is an issue of jobs and education, not one of a rigid ideology. We've noted in the past how local Republicans and Democrats have fought side by side on these matters. But last year, National Journal traced the growth of partisanship on municipal networks at the federal level.
In this analysis, we counted each community as one vote. Chattanooga, with its large population counts the same as tiny Windom, Minnesota. We analyzed the data in two different ways to ensure that clusters of municipal networks didn't bias the results. Some districts have multiple municipal networks within them, so we first considered every community to have one vote and then we separately considered just every district that has a network. This means that if a district had 5 municipal networks, in one analysis it would count 5 times and in the other, it would only count once. The results were very similar so we just show the pie charts where every community is included.

It’s official. Falmouth, Massachusetts has established a legal framework, a telecommunications utility, that is a key milestone in a local effort to bring fiber-to-the-home (FTTH) Internet service to this seaside community of approximately 32,000 famous for being home to a world-class marine science community as well as a popular summer vacation destination.

In November, a majority of voters in China (not the country, but a small town in Maine) cast their ballots in opposition to a $6.4 million proposal for a municipal broadband network that, if built, would have provided high-speed Internet access to every household and business in this central Maine town of 4,300.

Cities and towns all over Massachusetts are looking for alternatives to the big incumbent Internet Service Providers in their communities as citizens across the Commonwealth have grown weary of the high-cost, second-rate Internet service – and lack of competition – that plagues markets dominated by monopoly providers.

Broadband was on the ballot as voters went to the polls for Election Day in many areas. Here’s a quick run-down of what happened.
Colorado

Congress and the White House are currently managing a handful of different infrastructure proposals which are coming down the pipeline fast.