Image


Fast, affordable Internet access for all.
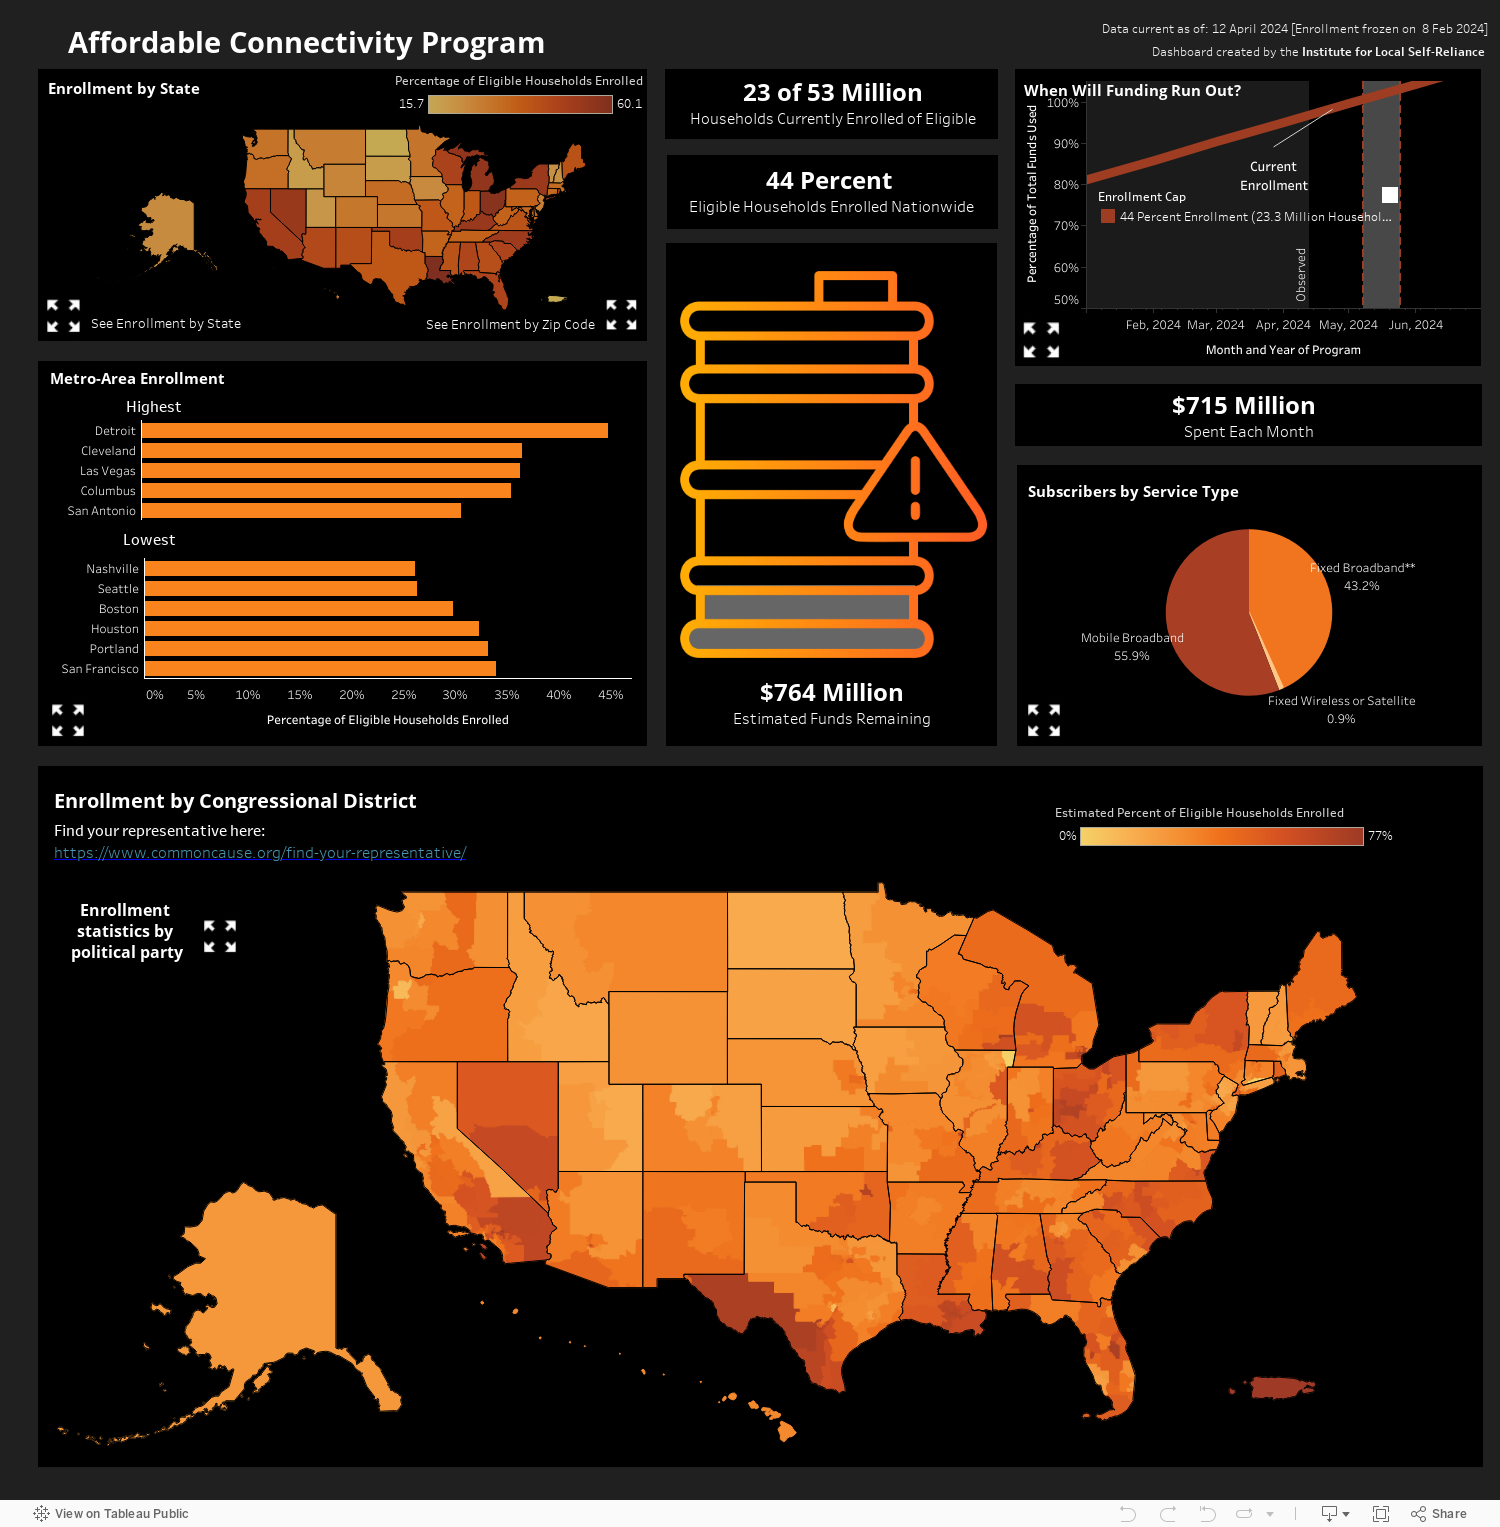
This dashboard visualizes the data released on Affordable Connectivity Program enrollments by the Universal Service Administrative Company.
On January 1st, 2022, the Federal Communications Commission launched the Affordable Connectivity Program (ACP) with $14.2 billion in funding designed to help American households pay for the monthly cost of their Internet subscription. Eligible households get $30/month to help defray the cost of service, and up to $100 for an Internet-capable device to get online. Residents living on Tribal land can receive up to $75/month for service, reflecting the higher cost of connectivity in Indian Country. On August 5th, the commission announced the launch of an outreach program designed to boost awareness and participation.
This dashboard has two interactive features. Click on the breakout buttons in the corner of dashboard elements to open a full-sized view (use the Home button to return). Or, use control + left click to interact with multiple elements inside of a single dashboard element, and build custom data sheets (see video below).
This dashboard will be updated every other week. Last update: August 29, 2022. Read about how this dashboard was built below. For comments, questions, and suggestions, email us at broadband@muninetworks.org.
Tens of millions of households are eligible for the ACP benefit, but how many of those actually sign up is predicated on a wide variety of factors, including: whether their Internet Service Provider (ISP) participates, how easy their ISP makes the enrollment process, education efforts by state and local officials, outreach efforts by nonprofits, community trust in government, and much more.
This element shows which states are seeing the highest numbers of eligible households enroll. Hover over each state to also see how many households have signed up, as well as dollar amounts for how much we estimate has been spent there so far. Click on the breakout button to see a zip-code-level breakdown of enrollment rates and money spent.
The $14.2 billion allocated for the Affordable Connectivity Program won’t last indefinitely. At present, almost $400 million a month is being disbursed to the proportion of eligible households that have signed up. As more eligible households sign up, that drawdown will speed up.
This element models when the funds will be exhausted based on different enrollment caps. It’s impossible to predict how many of the eligible households will sign up. Internet Service Provider participation and marketing, local education and outreach efforts, digital literacy skills, and community trust all factor into a household’s ability and decision to participate. The FCC’s new outreach program is likely to boost these numbers, but we don’t know by how much yet. These projections have a 95 percent confidence interval that can be viewed, along with more about how our prediction model was built, here.
The ACP is (rightly) being lauded as a program that will help millions of Americans get onto the Internet for the first time, and allow millions more to subscribe to faster wireline connections to allow them to work, learn, visit the doctor, and maintain their social networks from home. But the data reveals the array of important policy questions that should flow from how the money is being spent so far. For instance, 60 percent of the households currently using the benefit are applying it to their mobile phones, which are inherently less versatile and powerful than laptop or desktop connections.
This element shows what types of connections households are using the benefit for, the portion of funds going to Tribal versus non-Tribal households, and how much of the ACP fund spent so far (about $1.7 billion as of 8/29/22) has been spent on monthly subsidies ($30 or $75) versus helping with the cost of new devices (single-use $100 per household).
In June, the Benton Institute for Broadband and Society’s John Horrigan published an analysis in order to identify more clearly what is driving higher or lower enrollment rates in major metropolitan areas. With Benton’s permission, we visualize those 30 cities here at the zip code level. Read Horrigan’s full piece for much more detail, including the effect that local nonprofits, digital equity coalitions, and anchor institutions like libraries have on driving sign-ups.
We can see here that there are definite lessons to be learned in Miami-Dade, Florida, where many of the zip codes are seeing greater than 75 percent enrollment. Likewise for Nashville, Tennessee, where many zip codes are seeing enrollment rates in the single digits.
This dashboard was built using Census Bureau data to determine eligibility, and displayed using the Tableau platform.
Households can qualify for the Affordable Connectivity Program in a number of ways - from falling under the threshold for 200 percent of the value of the annual federal poverty level (FPL), to receiving a Pell grant in the previous year, to participation in one of the array of federal assistance programs (e.g., SNAP, WIC, Medicaid, the National School Lunch Program).
In this visualization, we have only used the 200 percent FPL value to determine the number of eligible households that can take the ACP benefit: 36.6 million. This number is derived using annual household income estimates from the 2015-2019 American Community Survey (ACS) 5-Year tables at the Zip Code Tabulation Area (ZCTA)-level. Only annual household incomes that fell within the 2019 value for 200 percent FPL (e.g. for a household of three, this would be $42,660 in the continental United States) were included in our calculations. Our estimates are based on a modified version of the methodology used by Rural LISC. We incorporated slight upward adjustments for Alaska and Hawaii).
An important note: This methodology undercounts the total number of households eligible for the ACP, and therefore over-represents the enrollment rate (36.5 percent as of August 29, 2022), because it does not include those households whose annual income exceeds 200 percent of the FPL but who still qualify for one of the other assistance programs and thus the ACP. For example, the White House cites a recent Columbia University study which places the total number of eligible households at 48 million. The study calculates the number of households above the 200 percent FPL threshold who still qualify at roughly 12 million, using microdata from the Census Bureau. While our estimate includes households below the 200 percent FPL who may qualify for additional federal programs, it does not include the households above 200 percent FPL.
We acknowledge this over-representation of the enrollment rate results in the appearance that the program is doing a better job than the reality of signing up households, and that it also suggests that the fund will be exhausted a handful of months sooner than what is currently likely. We are working to build these additional households into the next revision of this dashboard, once we believe we can faithfully represent the remaining additional households that are eligible with as much nuance as is possible. In the meantime, we have included 25- and 30-percent enrollment caps in the prediction graph to demonstrate those lower enrollment rates.
We strongly believe, however, that to some extent measuring the total number of eligible households and the relative enrollment rate with perfect precision misses the larger point of the policy discussion surrounding the Affordable Connectivity Program. Once the fund is exhausted, absent additional appropriation that benefit will go away. Our analysis from May still stands:
“In all of these cases, unless Congress reappropriates funds to fill the benefit bank account back up, those families will see their monthly bills jump by $30. To continue to fund the ACP, we’re looking at a permanent commitment of billions to tens of billions of dollars every year - and to be clear, these are public tax dollars, of which the vast majority are disappearing into the pockets of monopoly ISPs that have been posting huge profits in captured markets that they’ve defended against the specter of competition at both at the local and national level for years. It’s also important to remember that under all of these models, assuming no Congressional reappropriation comes, those households that sign up last will only see the benefit for a month or two before being cut off.”
To learn more, see the list of Resources at the top of this page. We’d love to hear your feedback. For comments, questions, and suggestions, email us at broadband@muninetworks.org.
There are a host of wonderful resources if you’re curious to learn more. If you see something that should be added to our list below, please email us at broadband@muninetworks.org