Image

Fast, affordable Internet access for all.

Written by Christine Parker
See the interactive resource, United State(s) of Broadband Map, here. Updated on June 1, 2022.
View and download an HTML version of the map here. To view, open it in any web browser.
Updates can be shared with Christine Parker at christine@ilsr.org.
*If at any point the HTML file stops working, it's because the map has been updated. Just return to this story or that dropbox folder and redownload the file at the link above.
Tens of billions of dollars in federal funding are poised for new broadband infrastructure deployment over the next five years. But a crucial step in allocating funds from the Broadband Equity, Access, and Deployment (BEAD) Program - for states and local governments - lies in knowing where fast, affordable, reliable broadband access currently is, so that they know where to drive new investment. The FCC’s historical and repeated failure to put together an accurate national broadband map threatens to significantly hold up the process.
Gigi Sohn is still up for confirmation by the Senate to complete the Federal Communications Commission (FCC) - an independent agency in the executive branch of the federal government that has been stuck at a 2-2 split of Democrats and Republicans since President Biden took office. The FCC is supposed to operate with five commissioners, with the party of the President in power having 3 seats.
She was the obvious choice in December of 2020, when it was clear that Joe Biden would take office. With decades of history in telecom and media-related policy as well as a recent stint as Counselor to Tom Wheeler when he was Chair of the FCC, she would be among the most-qualified people to serve on it since I began working in telecom in 2007. And by among, I mean at the top.
I’ve known Gigi for many years and respected her from the first time I saw her in action. She isn’t a political agent trying to figure out the best path to the top. She has strong beliefs, and she’ll tell you what they are in a wonderful Long Island blur of passion. She respects other beliefs and ideas but she isn’t going to pretend she agrees with you when she doesn’t.
Maybe my word isn’t that persuasive, because I tend to agree with Sohn on many issues. But a lot of people with far more credibility among conservatives have spoken up on Gigi. So I hadn’t written anything about this because I assumed it would take time but Gigi would get confirmed. Plus, I focus my work outside DC and there is a lot going on that is keeping us busy.

It’s been one long year since Chris took a bet with Travis over the FCC updating the definition of broadband, and this week we’ll find out who won (not looking good, Chris). In this episode of the Connect This! Show, co-hosts Christopher and Travis Carter (USI Fiber) are joined by regular guests Kim McKinley (UTOPIA Fiber) and Doug Dawson (CCG Consulting) to talk about current events in broadband.
The panel will talk about the FCC definition of broadband, MDUs, other recent news and will continue their conversation about redlining and digital discrimination.
Subscribe to the show using this feed on YouTube Live or here on Facebook Live, or visit ConnectThisShow.com.
Email us broadband@muninetworks.org with feedback and ideas for the show.
Watch here on YouTube Live, here on Facebook live, or below.
Last year, the Confederated Tribes of the Colville Reservation in Washington State were one of 327 Native Nations to receive wireless spectrum as part of the FCC’s Rural Tribal Window program. Since then, tribal leaders have put that spectrum to use by offering free wireless services that have proven to be a lifesaver during the Covid-19 crisis.
The Rural Tribal Window program offered tribal access to one 49.5 megahertz channel, one 50.5 megahertz channel, and one 17.5 megahertz channel in the 2.5 Ghz band. Tribal applicants could apply for one, two, or all three of the channels, depending on availability.
Building Community Capacity
The Colville tribes say the spectrum allowed them to bring connectivity to 80 percent of the reservation in two phases. The already-completed Phase One brought access to the communities near Keller, Washington, while Phase Two will bring access to the remaining communities by 2026.
“COVID was a shock to everyone, and it became obvious as time went on that there were a lot of kids who had no access to the Internet or devices to connect with,” Andrew Joseph Jr., Chairman of the Colville Tribal Council, told ILSR. “With school going to virtual learning, and the importance of the Internet generally in this day and age, it was necessary to ensure that something be done to make the Internet accessible.”
In addition to the wireless network plan, the tribes are also stringing fiber along Highway 155 between Nespelem and Omak, Washington. Cumulatively, the projects hope to finally bring access to long-neglected areas, many of which aren’t particularly remote yet have been historically neglected by regional monopolies.
“There are temporary networks in all four districts now,” Joseph said of the project’s progress. “There is not a hard count of all connections. The Tribes have grant applications pending to help fund the next step in the project plan, which includes the need to bring Internet access to more and remote areas, as well as laying down the building blocks for additional opportunities in the future.”
Searching for Permanent Solutions
In this episode of the Connect This! Show, co-hosts Christopher and Travis Carter (USI Fiber) are joined by regular guests Kim McKinley (UTOPIA Fiber) and Doug Dawson (CCG Consulting) to talk about current events in broadband.
The panel will reflect on RDOF: one year later, how demands for remote work are fueling the broadband boom, and the latest news in broadband.
Subscribe to the show using this feed on YouTube Live or here on Facebook Live, or visit ConnectThisShow.com
Email us broadband@muninetworks.org with feedback and ideas for the show.
Watch here on YouTube Live, here on Facebook live, or below.

The FCC’s Rural Digital Opportunity Fund (RDOF) Reverse Auction was completed a little more than a year ago to much fanfare and spilled ink, and though we’ve seen irregular updates over the last twelve months, we thought it worth the time to round up what we know so far in an effort to see where we’re at and determine what is likely to come.
The RDOF was built to award up to $20.4 billion in grants over 10 years using competitive reverse auctions generally won by the lowest bidder. The money comes from the Universal Service Fund fees affixed to consumers’ monthly telecom bills. The previous FCC announced $9.2 billion in auction winners in December of 2020.
To date the FCC has announced five rounds of Authorized funding released, six rounds of applicants whose bids they have decided are Ready-to-Authorize, and three rounds of Default bids. In total, a little more than half of the $9.2 billion won during the auction has been handed out as of January 14th, 2022, with another $1.3 billion announced on January 28th as ready to be disbursed shortly.
It’s clear that the final picture is still taking shape, but looking at things a year later leaves us feeling a little better than we were immediately after the auction closed. To date, it appears the FCC is closely scrutinizing many of the bidders that most worried industry veterans and broadband advocates, while releasing funds for projects that will bring future-proof connectivity to hundreds of thousands of homes over the next ten years.
Moving Slowly on Problematic Awards
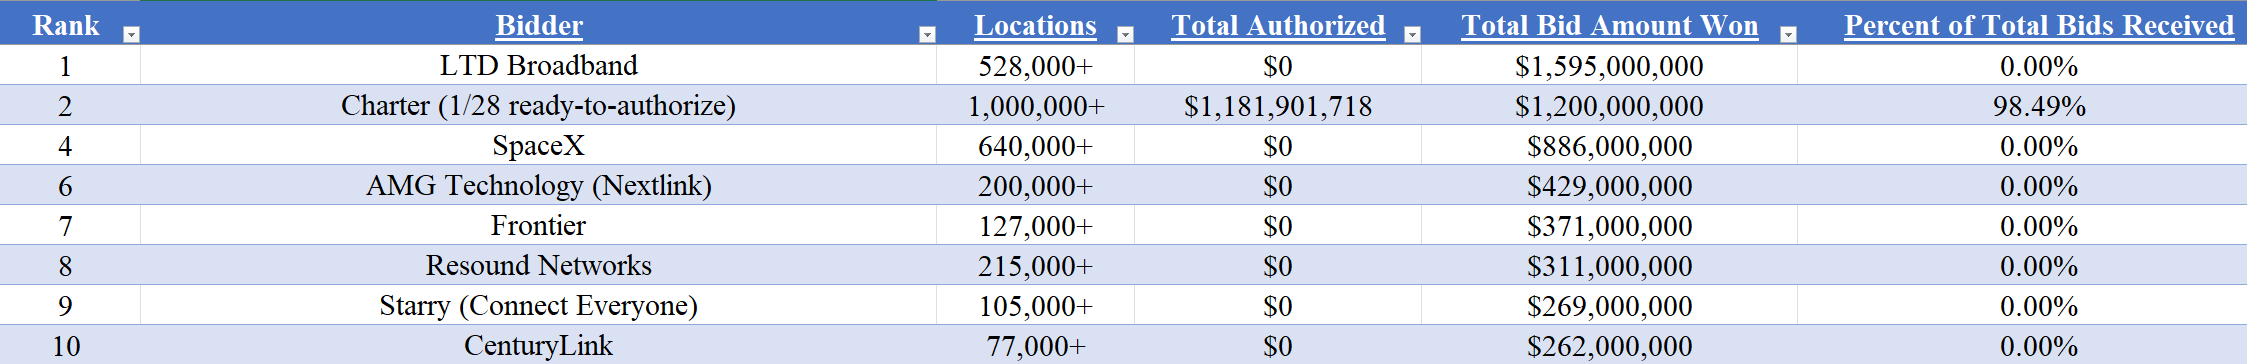
The biggest news so far is that of the top ten winners, seven look to have received no funds at all (see table below or high-resolution version here). That’s $4.1 billion worth of bids for almost 1.9 million locations, and includes LTD Broadband, SpaceX’s Starlink, AMG Technologies (NextLink), Frontier, Resound Networks, Starry (Connect Everyone), and CenturyLink. This is a big deal.
In November, the Institute for Local Self-Reliance published a report examining the transparency practices of Internet Service Providers (ISPs). Shopping for Broadband: Failed Federal Policy Creates Murky Marketplace [pdf] identified locally-controlled broadband networks as the most transparent around key service details.
Large ISPs, however, were found to be more likely to make information like upload speed and pricing difficult or impossible for potential customers to find.
After the report’s original publication, a WISP advocate suggested that our fixed wireless sample may not appropriately represent the industry and requested that we review and re-issue our analysis with an alternative list of ISPs that have been more aggressive in pursuing federal funding and spectrum opportunities. These WISPs greatly outperformed our original sample, which was selected based on those claiming the largest population coverage.
New Set of WISPs Shows Better Transparency
While many of the original WISPs failed to disclose basic pricing and service information, only two of the second set offered less than excellent information in all categories. The second set had less poor quality information and slightly more missing information than our set of cooperatively-run networks. Municipal networks remained the most transparent.
Though many of the fixed wireless providers originally studied do seem to claim the greatest number of potential customers, we agree with some reviewers that they are not actually among the largest fixed wireless ISPs with the most subscribers. The new list of WISPs, which is included alongside the original one on the Broadband Transparency Rule Compliance Scorecard, may be a more accurate representation of providers’ transparency practices in this industry.
With all due respect to Federal Communications Commissioner Brendan Carr, his reaction to the Rescue Plan Act's State & Local Fiscal Recovery Fund (SLFRF) spending rules is way off base. As I wrote last week, the rules for broadband infrastructure spending are a good model for pushing down decision-making to the local level where people actually have the information to make informed decisions. (Doug Dawson recently also responded to Commissioner Carr’s statement, offering a response with some overlap of the points below.)
The Final Rule from the Treasury Department gives broad discretion to local and state governments that choose to spend some of the SLFRF (SLurF-uRF) funds on broadband infrastructure. The earlier draft of rules made it more complicated for networks built to address urban affordability challenges.
However, in coming out against the rules, FCC Commissioner Carr is giving voice to the anger of the big cable and telephone monopolies that cities can, after collecting evidence of need, make broadband investments even in areas where those companies may be selling services already. Commissioner Carr may also be frustrated that he has been reduced to chirping from the sidelines on this issue because the previous FCC, under his party’s leadership, so badly bungled broadband subsidies in the Rural Digital Opportunity Fund (RDOF) that Congress decide NTIA should administer these funds and have the state distribute them.
Nonetheless, the issues that Commissioner Carr raised are common talking points inside the Beltway and we feel that they need to be addressed.
Background Note
The failure of the FCC to assemble an accurate data collection is many years in the making. No single presidential administration can take the full blame for it, but each of them could have corrected it.
President Biden’s FCC is not yet fully assembled because of delays in appointment and in Senate confirmation, but it would not be reasonable to lay blame on the current FCC for the failures discussed below. That said, it is not clear that we are on a course for having better maps and data that will resolve these problems anytime soon.
Commissioner Carr’s Criticism
In this episode of the podcast, we're back for another staff conversation about all that 2021 had to offer and serve up some predictions for the coming year. Joining Christopher on the show are Senior Reporter and Editor Sean Gonsalves, Community Broadband Outreach Team Lead DeAnne Cuellar, Senior Researcher Ry Marcattilio-McCracken, GIS and Data Visualization Specialist Christine Parker, and Associate Broadband Researcher Emma Gautier.
Christopher, Ry, and Sean reckon with their predictions from a year ago, with DeAnne, Christine, and Emma joining the podcast for the first time. During the conversation, we talk about the number of preemption laws we hope to see disappear in 2022, the strides taken in small and medium-sized cities to take control of their telecommunications infrastructure future, mapping, and the impact the unprecedented amount of federal money is likely to have across the country in the coming year.
This show is 50 minutes long and can be played on this page or via Apple Podcasts or the tool of your choice using this feed.
Transcript below.
We want your feedback and suggestions for the show-please e-mail us or leave a comment below.
Listen to other episodes here or view all episodes in our index. See other podcasts from the Institute for Local Self-Reliance here.
Thanks to Arne Huseby for the music. The song is Warm Duck Shuffle and is licensed under a Creative Commons Attribution (3.0) license.
On this week’s episode of the Community Broadband Bits Podcast, Christopher Mitchell is joined by Derek Turner, the research director for Free Press, to talk about the history of the federal government's broadband data collection and how the Form 477 came to be. They unpack how this data collection process has been historically flawed and how it has evolved over the years. While the FCC continues to make adjustments to reporting procedures for Internet Service Providers, there have always been flaws, leaving communities unconnected or unserved.
Listen to CBB Episode 484 to learn more about the potential pitfalls in the newest changes to the FCC's data collection.
This show is 40 minutes long and can be played on this page or via Apple Podcasts or the tool of your choice using this feed.
Transcript below.
We want your feedback and suggestions for the show-please e-mail us or leave a comment below.
Listen to other episodes here or view all episodes in our index. See other podcasts from the Institute for Local Self-Reliance here.
Thanks to Arne Huseby for the music. The song is Warm Duck Shuffle and is licensed under a Creative Commons Attribution (3.0) license.